Export TikTok Ads to Tableau: Automated Pipeline & Net ROAS
Export TikTok Ads to Tableau with automated API pipelines and true Net ROAS models. Eliminate manual CSV dumps and connect multi-account data.
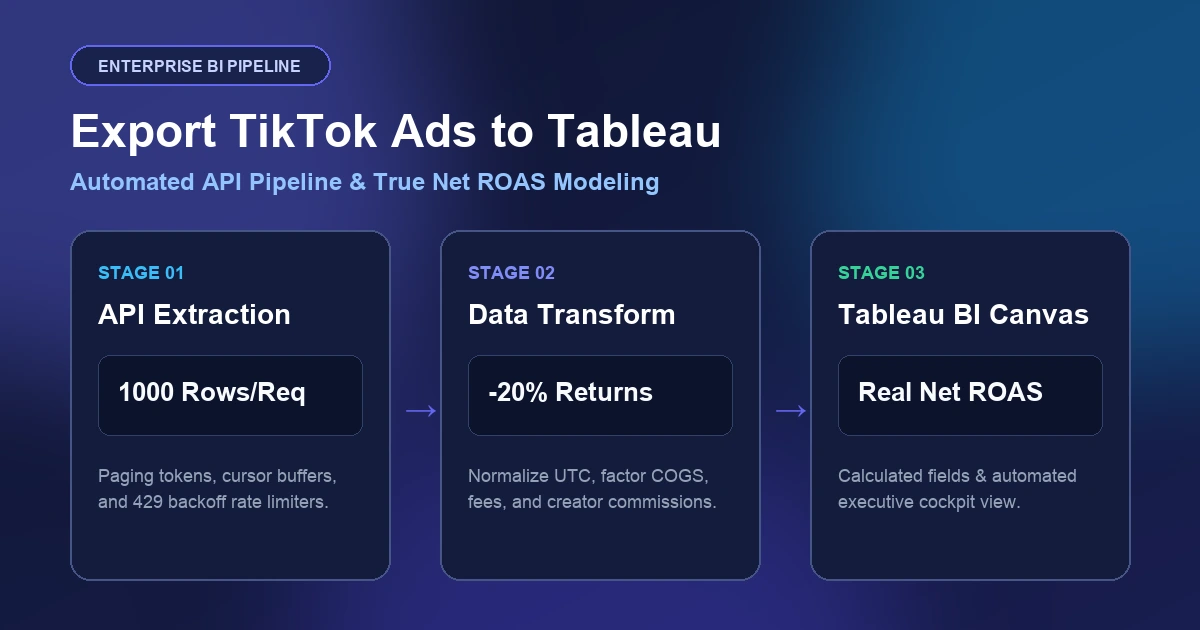
E-commerce brands and performance marketing agencies scaling TikTok Ads often hit a data visibility ceiling. While native TikTok Ads Manager provides intraday metrics, modern media buyers manage cross-channel budgets across multiple TikTok Business Centers, Shopify storefronts, and warehouse fulfillment feeds. Manually downloading CSV spreadsheets every morning burns hours of operational bandwidth and introduces fatal formula drift.
When you export TikTok ads to Tableau, you unify paid media spend with real-time backend revenue. However, building an enterprise-grade Tableau reporting engine requires more than dumping gross ad clicks. You need resilient automated data extraction, normalized multi-currency dimensions, and dynamic net profitability modeling.
This guide outlines three integration paths to connect TikTok Ads to Tableau, tackles core API pagination traps, and delivers a production-ready Net ROAS calculation framework.
3 Architectural Paths: Manual vs Third-Party Connectors vs Direct API
Before writing code or subscribing to recurring middleware, evaluate which integration method aligns with your engineering resources and data volume.
| Integration Architecture | Automation Level | Latency & Reliability | Cost Structure | Best Suited For |
|---|---|---|---|---|
| Manual CSV Export | Manual daily/weekly upload | High friction; human error prone | Free | Early validation (< 3 accounts) |
| Commercial Middleware | Automated scheduled sync | Managed connectors; API rate limits | High ($200--$1,000+/mo scaling tiers) | Teams without dedicated data engineers |
| Direct API & Cloud Warehouse | 100% programmatic automation | Sub-hour latency; custom data governance | Low cloud compute (Snowflake/BigQuery/Postgres) | Scaling agencies & high-volume DTC brands |
If your reporting stack relies on spreadsheet workbooks, review our breakdown on exporting TikTok ads to Google Sheets with automatic refresh or our deep dive on building a TikTok ads pipeline for Power BI.
Path 1: Manual CSV Ingestion (The Low-Volume Baseline)
While unsuitable for automated decision-making, manual CSV ingestion is helpful for one-off cohort analyses.
- In TikTok Ads Manager, navigate to Custom Reports.
- Select dimension breakdowns:
Campaign ID,Ad Group ID,Ad ID,Stat Time Day, and performance metrics (Cost,Impressions,Clicks,Conversions,Gross Revenue). - Export as CSV and connect Tableau Desktop directly via the Text file data source connector.
- The Core Limitation: Column headers frequently drift when TikTok updates reporting schemas, instantly breaking downstream calculated fields in Tableau.
Path 2: Commercial Connectors (Supermetrics, Fivetran, Coupler)
Third-party extractors use managed pipelines to dump TikTok Ads API data directly into cloud warehouses or provide direct Web Data Connectors (WDC) for Tableau. While convenient, SaaS connectors bill per destination account and enforce rigid request polling intervals. When scaling beyond 10 ad accounts, recurring costs multiply rapidly.
Path 3: Direct API Ingestion into Cloud SQL or Hyper Extracts
The enterprise gold standard extracts raw data from the official TikTok Marketing API via Python or lightweight serverless functions, loading records into an analytical database (PostgreSQL, Snowflake, or Google BigQuery) that Tableau queries live.
import requests
import json
import pandas as pd

// Fetch core reporting metrics from TikTok Marketing API v1.3
API_ENDPOINT = "https://business-api.tiktok.com/open_api/v1.3/report/integrated/get/"
HEADERS = {
    "Access-Token": "YOUR_TIKTOK_SECRET_API_TOKEN",
    "Content-Type": "application/json"
}

payload = {
    "advertiser_id": "YOUR_ADVERTISER_ID",
    "report_type": "BASIC",
    "data_level": "AUCTION_AD",
    "dimensions": ["ad_id", "stat_time_day"],
    "metrics": ["spend", "impressions", "clicks", "conversion", "real_time_conversion_value"],
    "query_lifetime": False,
    "page": 1,
    "page_size": 1000
}

response = requests.get(API_ENDPOINT, headers=HEADERS, json=payload)
data = response.json()
// Normalization step before writing to Tableau staging table
records = data.get("data", {}).get("list", [])

3 Technical Traps in TikTok Ads API to Tableau Pipelines
Connecting raw API payloads to Tableau visual canvases exposes three silent data corruption pitfalls:
1. The Paging Token and HTTP 429 Throttle Trap
TikTok's integrated reporting endpoint caps output at 1,000 rows per request. For multi-account setups running dynamic creative testing, daily data pulls generate thousands of lines. If your ingestion worker queries pages synchronously without exponential backoff, TikTok triggers an immediate HTTP 429 Too Many Requests response.
- The Remedy: Implement sliding-window rate limiters capped at 10 requests per second across shared tokens, persisting cursor bookmarks in Redis.
2. Time Zone and Attribution Lag Disconnect
Tableau server instances typically standardize on UTC. However, TikTok Ads Manager records report metrics in the specific time zone designated during ad account registration. Merging spend with Shopify order tables without explicit time zone normalization produces false attribution spikes. Furthermore, TikTok operates on flexible attribution windows (such as 7-day click / 1-day view); historical spend tables must support rolling 7-day retroactive updates to capture late-arriving conversions.
3. Gross ROAS vs True Net ROAS Blind Spot
Standard TikTok dashboards report Gross ROAS (Real-Time Conversion Value / Spend). In real-world e-commerce, gross return masks profit loss due to product returns, affiliate creator commissions, and TikTok Shop payment processing fees.
Building the Net ROAS Calculated Field in Tableau
To see true business profitability, define custom calculated fields inside Tableau rather than relying on raw dashboard revenue:
// Tableau Calculated Field: [True Net Revenue]
([Gross Ad Revenue] * (1 - [Estimated Return Rate]))
- [TikTok Shop Platform Fee (0.05)]
- [Creator Affiliate Commission Spend]
- [COGS Total]
Then construct your primary performance metric:
// Tableau Calculated Field: [Net ROAS]
IF SUM([Ad Spend]) > 0 THEN
    SUM([True Net Revenue]) / SUM([Ad Spend])
ELSE
    0
END
By mapping this calculation against custom thresholds, media buyers can filter ad groups into four distinct operating tiers:
- Scale Tier (Net ROAS >= 2.2): Aggressively expand daily budget allocations.
- Maintain Tier (1.5 <= Net ROAS < 2.2): Preserve creative pacing and monitor frequency.
- Warning Tier (1.0 <= Net ROAS < 1.5): Marginal profitability; flag for creative refresh.
- Kill Tier (Net ROAS < 1.0): Campaign operates at a net cash deficit; pause immediately.
Bridge Passive BI with AdRate Automated Execution
Tableau is an exceptional analytical lens, but visual dashboards are fundamentally passive. A visual alert identifying a negative ROAS ad set cannot pause spend while your team sleeps. By the time an analyst flags an underperforming campaign at 10:00 AM, thousands of dollars in ad budget have evaporated.
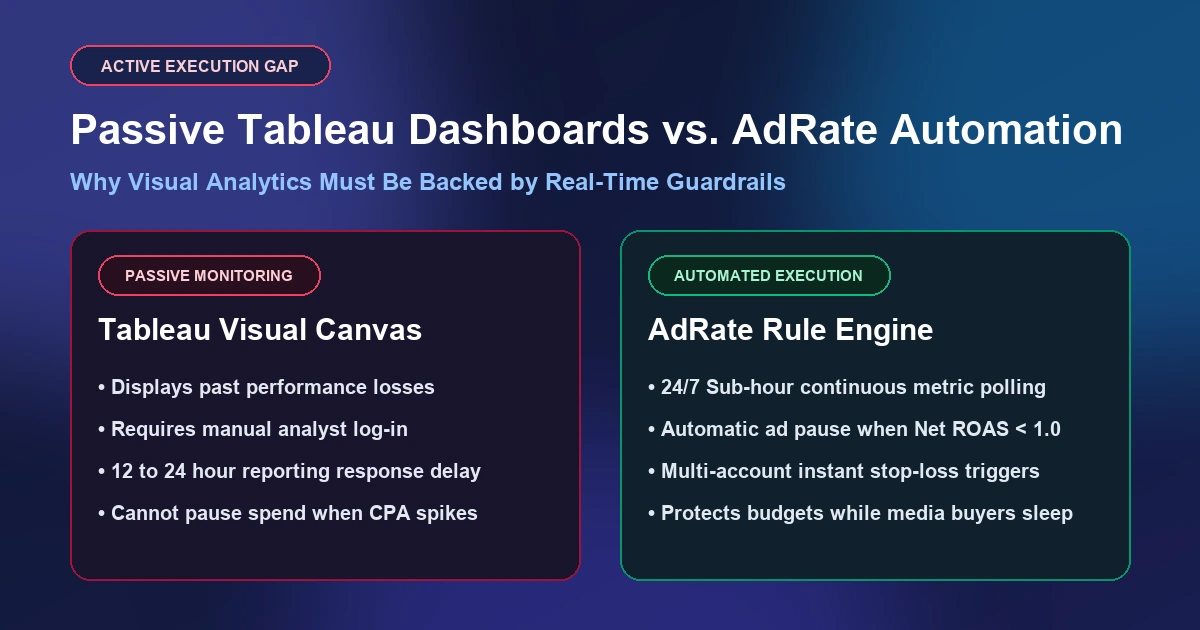
AdRate closes the loop between data intelligence and real-time execution:
- 24/7 Multi-Pipeline Protection: AdRate continuously polls TikTok Ads performance, detecting runaway CPAs and creative fatigue in real time.
- Automated Profit Kill Switches: Build multi-metric rules that automatically pause ad groups or adjust bid caps the moment performance breaches net profitability thresholds.
- Unified Multi-Account Engine: Manage creative libraries, duplicate winning campaigns, and control budgets across all client ad accounts from a single command center.
Transform your marketing data into proactive, automated execution. Connect your TikTok ad accounts and start your free 7-day trial of AdRate today.
Official TikTok new advertiser program - exclusive benefits for new advertisers
Open a new TikTok ad account and earn official ad credit as you spend
Spend $200 within 30 days of signing up and get $200 in ad credit, rising to $6,000 when you spend $10,000. Credits go straight into your TikTok ad campaigns.
Coupons are issued by TikTok once it confirms you qualify as a new advertiser. Actual issuance and tiers are shown on the Coupon Progress page inside your TikTok Ads account.